Table of Contents
Lab 05: MapReduce in the Cloud
By: Laureline David & Michael Rohrer
Pedagogical Objectives
- Perform data analysis in the cloud using a dynamically allocated cluster of machines
- Write a MapReduce program
- Become familiar with Hadoop
Tasks
In this lab you will perform a number of tasks and document your progress in a lab report. Each task specifies one or more deliverables to be produced. Collect all the deliverables in your lab report. Give the lab report a structure that mimics the structure of this document.
Task 1 - Using Elastic MapReduce
Copy the lines that are following and which contain several tens of counters into the lab report.
No such lines were found in the syslog, which is given as an annex, or the stderr files. It is probably because of the Hadoop distribution which is Amazon 1.0.3.
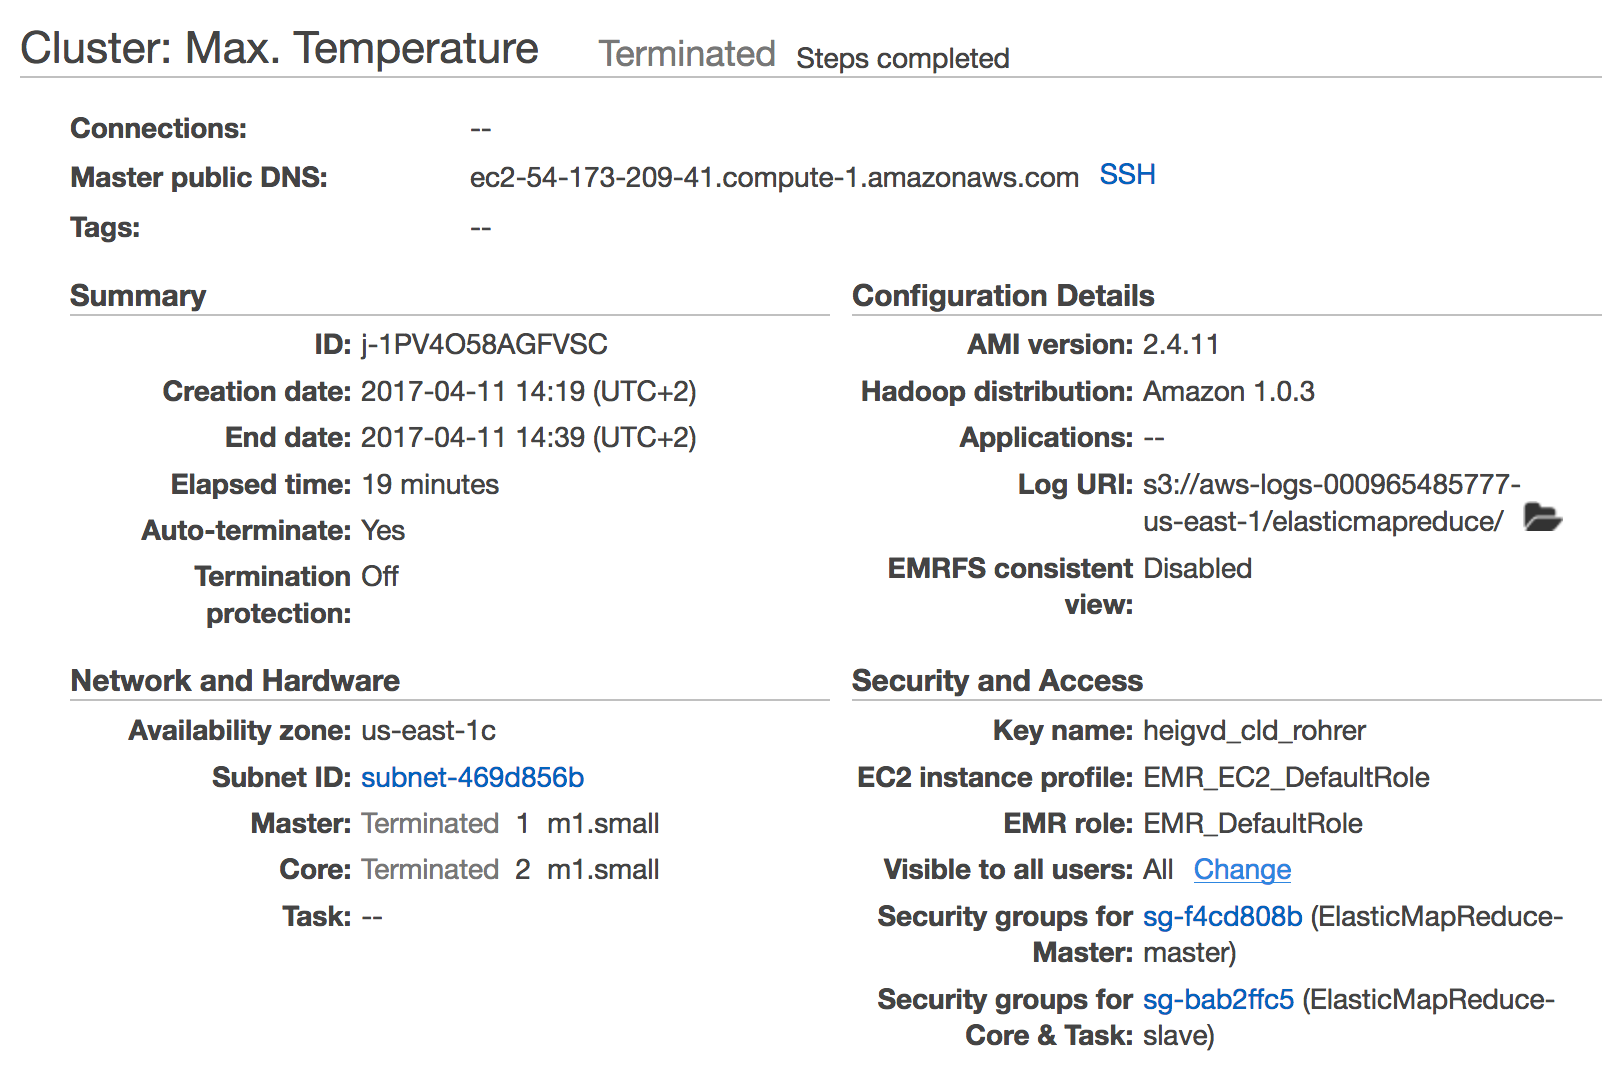
Copy a screenshot of the EMR console into the report.


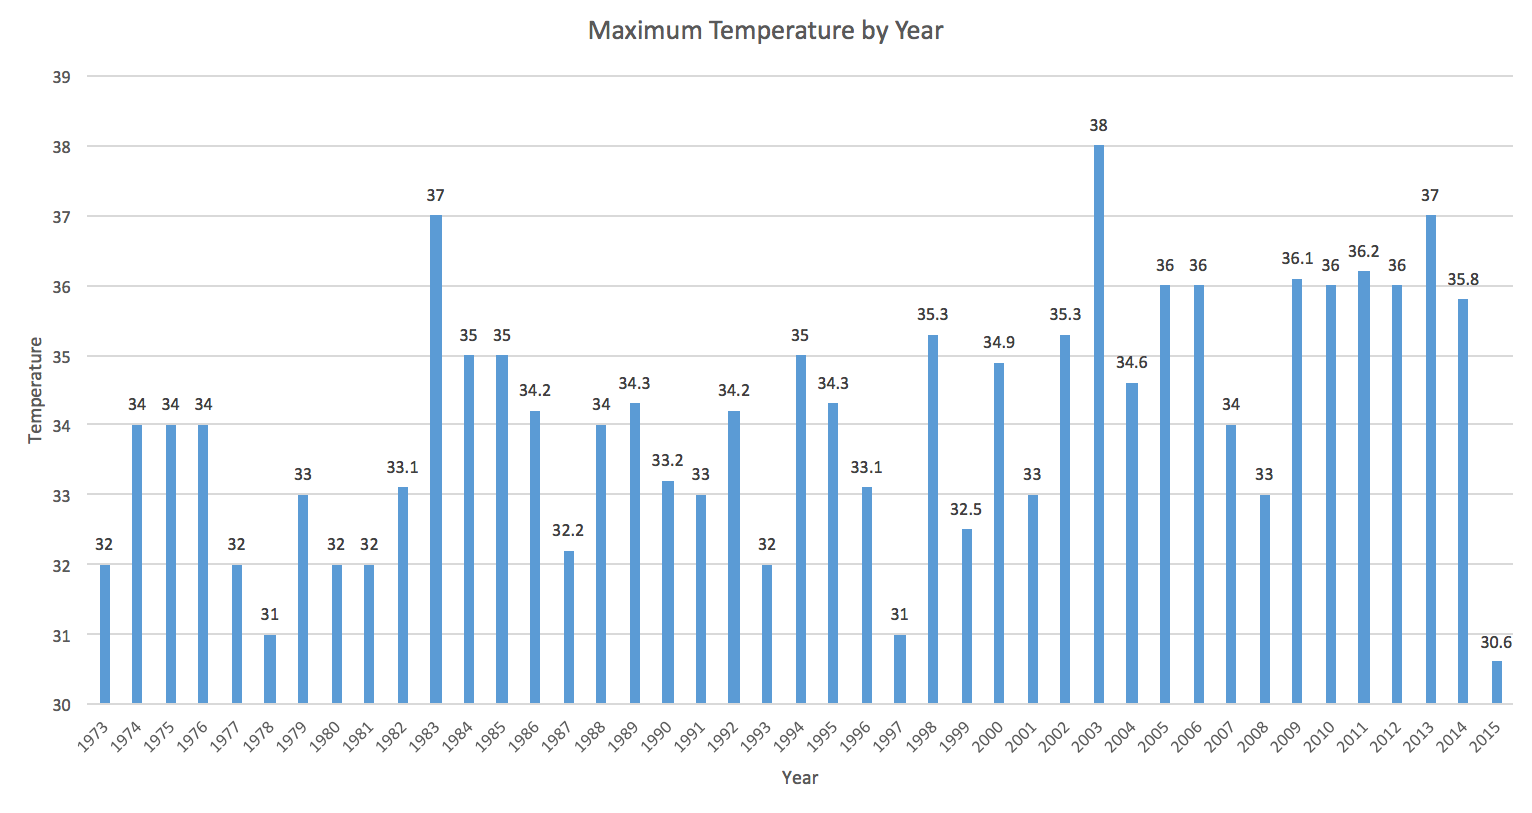
Copy the bar chart of maximum temperature by year into the report.

What is the overall highest temperature in the data set?
The overal highest temperature is 38.0 degrees. This temperature has been reached in 2003.
How many EC2 instances were created to run the job?
Three EC2 instances were created to run this job. We can see it on the next screnshot.

This pricing test has been made with 3 EMR instances of type m1.small. This job took 19 minutes to complete so we have been charged for a 1 hour. The price for it was about 0.18 $. It's important to notice that EC2 instances are already included in the price of EMR.

How many input key-value pairs all the mappers did process ?
It is not written in the log file. It is probably because of the Hadoop distribution which is Amazon 1.0.3. But we could have find it in the Map input records field.
How many input key-value pairs all the reducers did process ?
It is not written in the log file. It is probably because of the Hadoop distribution which is Amazon 1.0.3. But we could have find it in the Reduce input groups field.
Task 2 - Writing a MapReduce Program
Copy the code of the mapper and reducer into the report.
- mapper.py
#!/usr/bin/env python

import re
import sys

for line in sys.stdin:
  val = line.strip()
  temp = val[87:91]
  q = val[92:93]
  if (temp != "+999" and re.match("[01459]", q)):
    print "%s\t%s" % (temp, "1")
- reducer.py
#!/usr/bin/env python

import sys

last_key = None
count_val = 0
for line in sys.stdin:
  (key, val) = line.strip().split("\t")
  if last_key and last_key != key:
    print "%s\t%s" % (last_key, count_val)
    count_val = 0

  count_val += 1
  last_key = key

if last_key:
  print "%s\t%s" % (last_key, count_val)
- grapher.py
#!/usr/bin/env python

import sys
import math

# Maximum bar width
width = 120

temps = {}
maximum = 0
for line in sys.stdin:
  (key, val) = line.strip().split("\t")
  key = int(key)
  val = int(val)

  temps[key] = val
  maximum = max(maximum, val)

for key, count in sorted(temps.items(), key=lambda row: row[0]):
    print "{:+03d} | [{:6d}] {:s}".format(key, count, "X" * int(max(1, math.floor((count / float(maximum)) * width))))
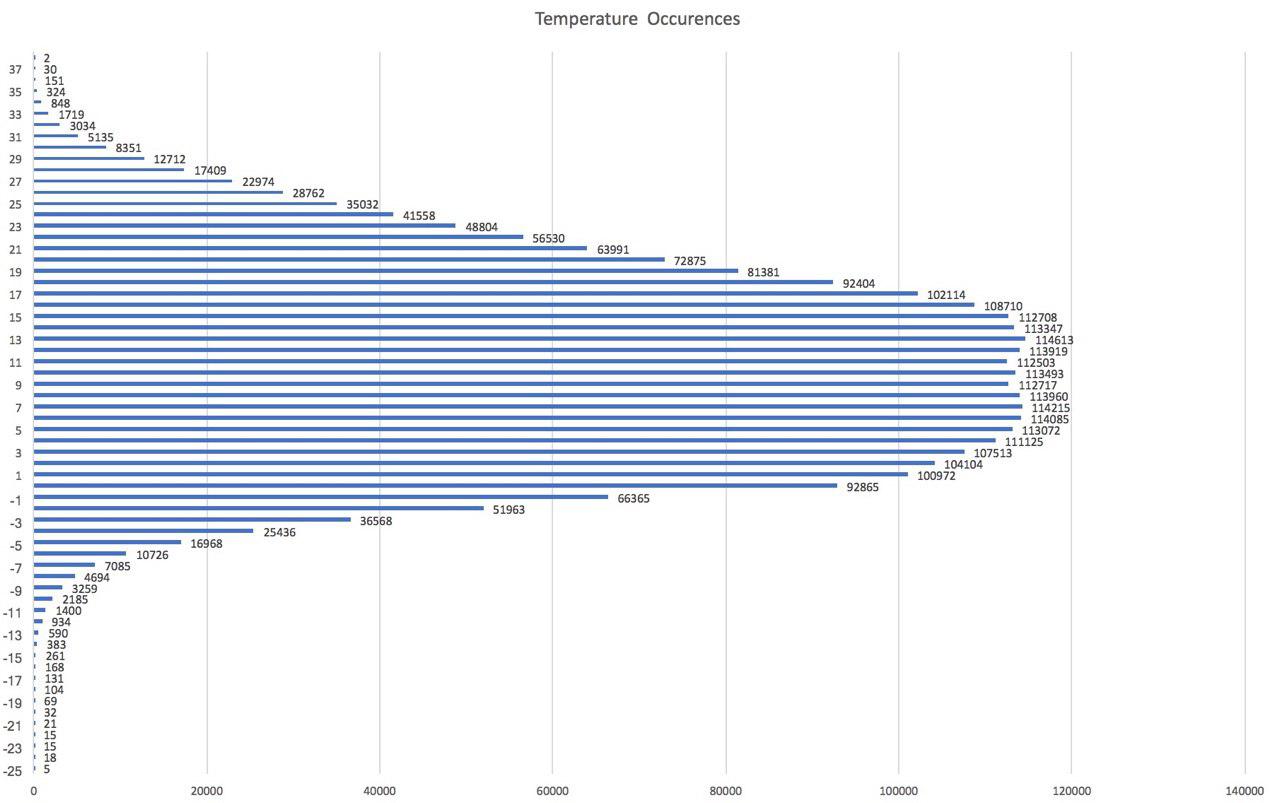
How often does the temperature 22 degrees celsius occur?
56'530 times
What is the lowest and highest temperature occuring?
Maximum is 38 degrees, minimum is -25 degrees.
Which temperature occurs most often?
14 degrees, with 114613 occurences.
Download the output data and using a spreadsheet produce a histogram.
