You are here: Links of Interest » HEIG-VD » [CLD] Cloud Computing » Lab 03: Google App Engine
Lab 03: Google App Engine
Table of Contents
Lab 03: Google App Engine
By: Laureline David & Michael Rohrer
PEDAGOGICAL OBJECTIVES
- Develop and deploy a custom web application on a PaaS infrastructure
- Use a data persistence service
- Conduct performance tests and observe the auto-scaling mechanisms of the platform
- Assess how quickly resources (quotas) are used up
TASKS
In this lab you will perform a number of tasks and document your progress in a lab report. Each task specifies one or more deliverables to be produced. Collect all the deliverables in your lab report. Give the lab report a structure that mimics the structure of this document.
Before working on the tasks of this lab create a Google account and set up a development environment as described in the document Preparation: Development environment for Google App Engine.
Task 1 - Deployment of a Simple Web Application
What does the code do?
The servlet responds to HTTP GET request and return “Hello, Word”.
What does the web.xml do?
It defines which url map to our servlet and how the application should be deployed.
What does appengine-web.xml do?
It defines how the application will be deployed on google's specific system. It is a configuration file that contains informations like the app's registered application ID and the version identifier of the latest code. It also provide a mean to identify which files are statics or which files are ressource files used by the app.
Task 2 - Develop a Servlet that uses the Datastore
Code
- DatastoreWriteServlet.java
package ch.heigvd.cld.lab;

import java.io.IOException;
import java.io.PrintWriter;
import java.util.HashMap;
import java.util.List;
import java.util.Map;
import java.util.logging.Logger;

import javax.servlet.ServletException;
import javax.servlet.http.HttpServlet;
import javax.servlet.http.HttpServletRequest;
import javax.servlet.http.HttpServletResponse;

import com.google.appengine.api.datastore.DatastoreService;
import com.google.appengine.api.datastore.DatastoreServiceFactory;
import com.google.appengine.api.datastore.Entity;


@SuppressWarnings("serial")
public class DatastoreWriteServlet extends HttpServlet{

	private static Logger LOG = Logger.getLogger(DatastoreWriteServlet.class.getSimpleName());

	@Override
    protected void doGet(HttpServletRequest req, HttpServletResponse resp)
                         throws ServletException, IOException {

		Map<String, String[]> params = req.getParameterMap();

		Map<String, String> values = new HashMap<>();
		String kind = null;
		String key = null;

		for (Map.Entry<String, String[]> entry : params.entrySet()) {
			String name = entry.getKey();
			String value = entry.getValue()[0];

			switch(name) {
			case "_kind":
				kind = value;
				break;
			case "_key":
				key = value;
				break;
			default:
				values.put(name, value);
				break;
			}
		}

        resp.setContentType("text/plain");
        PrintWriter pw = resp.getWriter();

        if (kind == null) {
        	pw.println("Requires '_kind' parameter");
        	return;
        } else {
        	pw.println("Writing entity to datastore.");
        }

        DatastoreService datastore = DatastoreServiceFactory.getDatastoreService();
        Entity book = null;
        if (key != null) {
        	book = new Entity(kind, key);
        } else {
        	book = new Entity(kind);
        }

        for (Map.Entry<String, String> pair : values.entrySet()) {
        	book.setProperty(pair.getKey(), pair.getValue());
        }
        datastore.put(book);
    }
}
Local Datastore
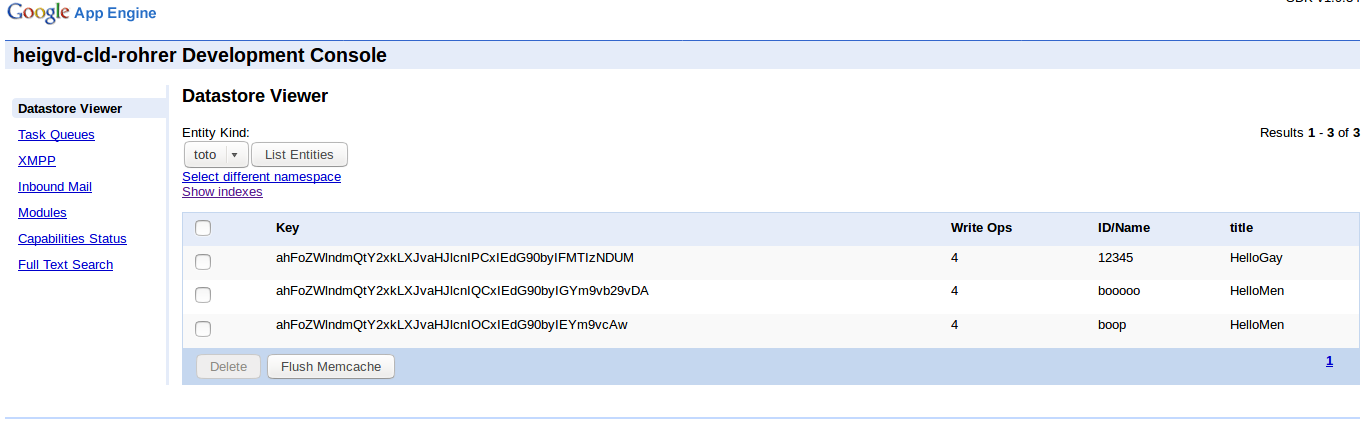
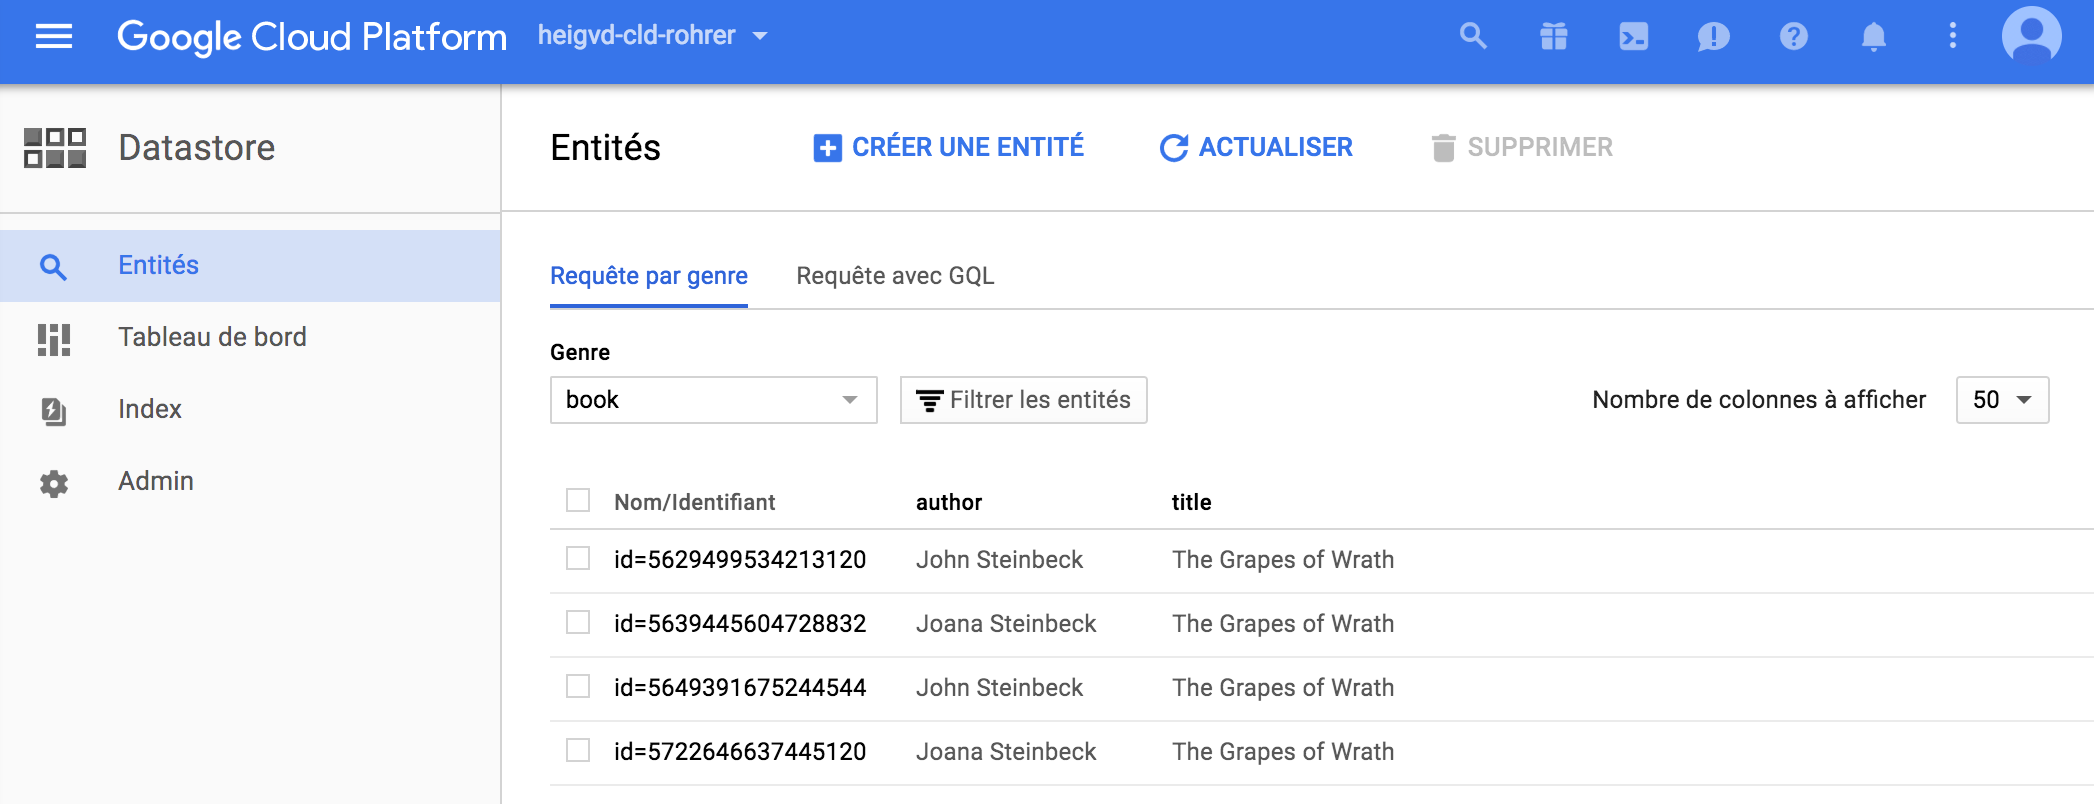
Datastore Viewer
Task 3 - Test the performance of Datastore writes
Stress test without storage
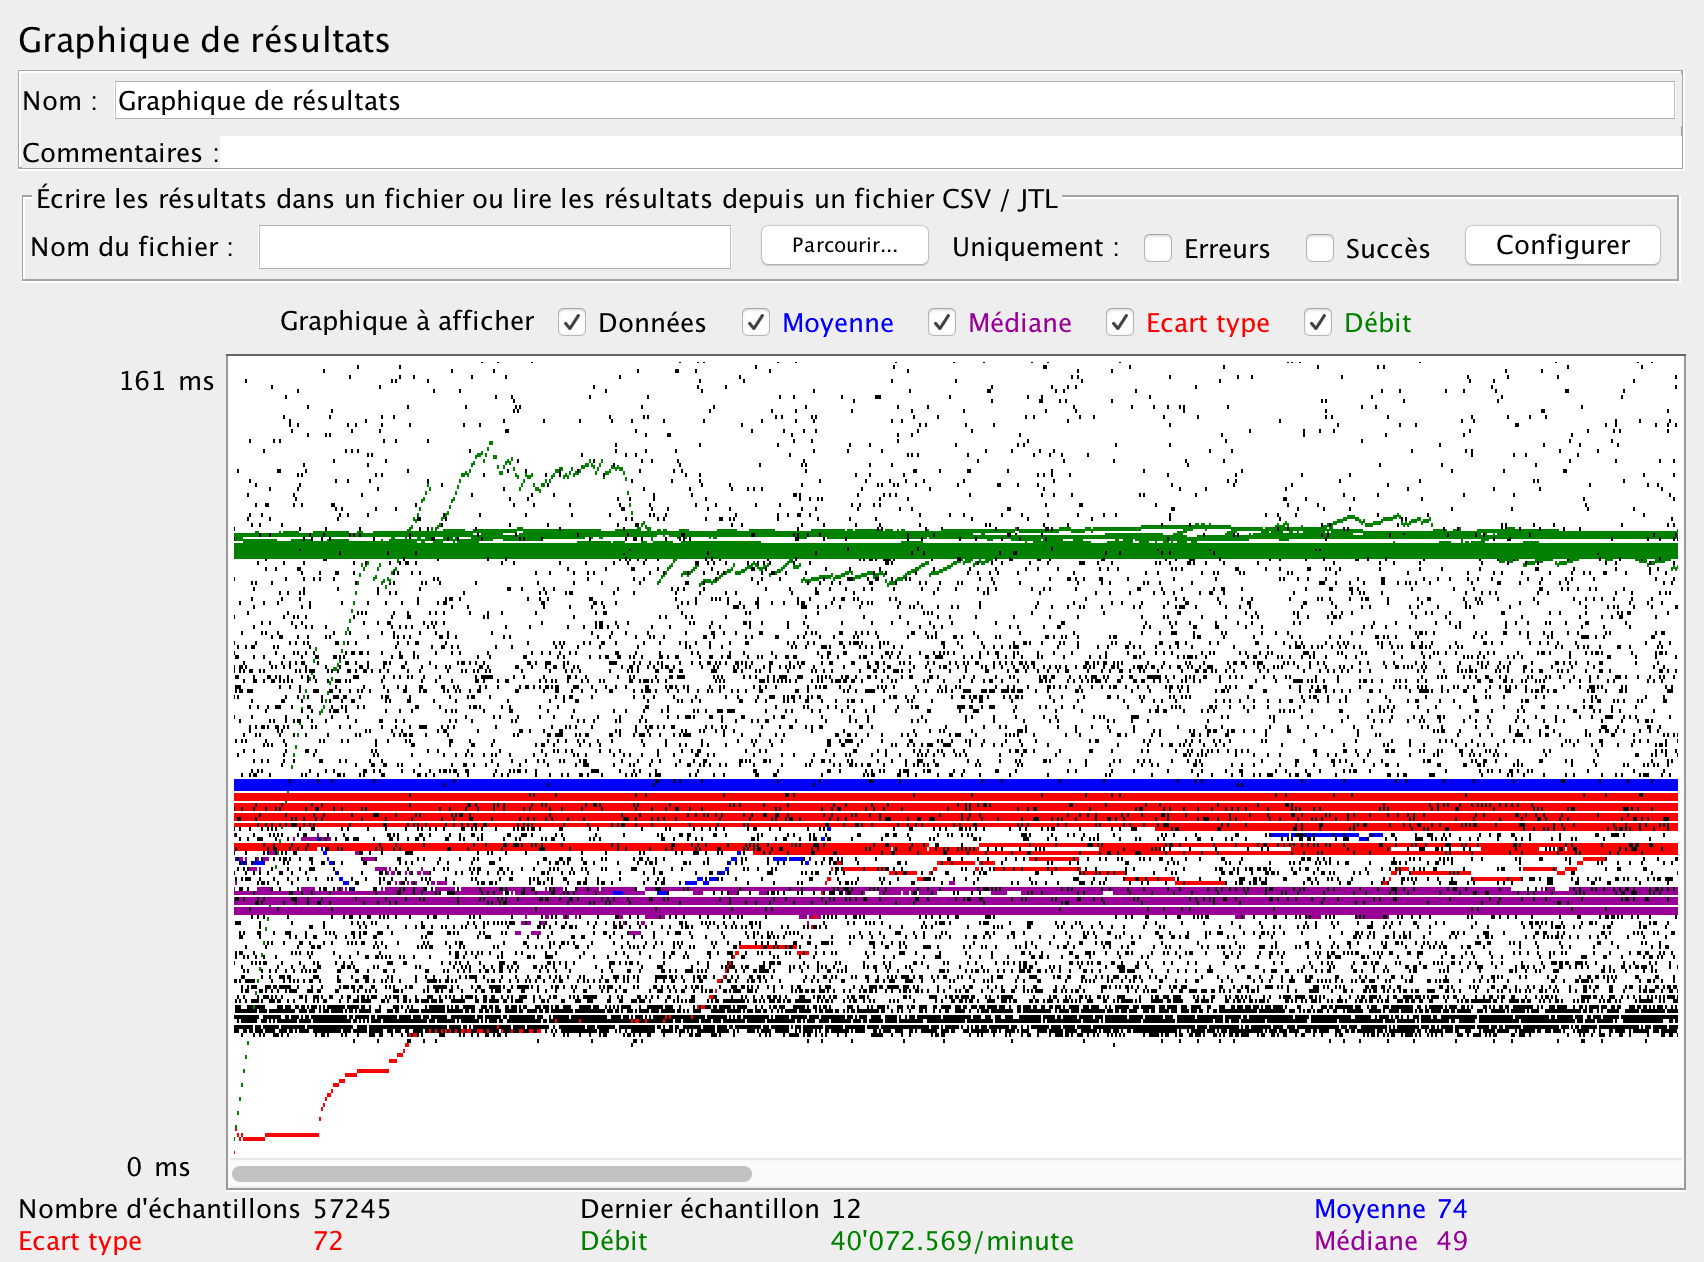
JMeter Graph Results
Request Graph
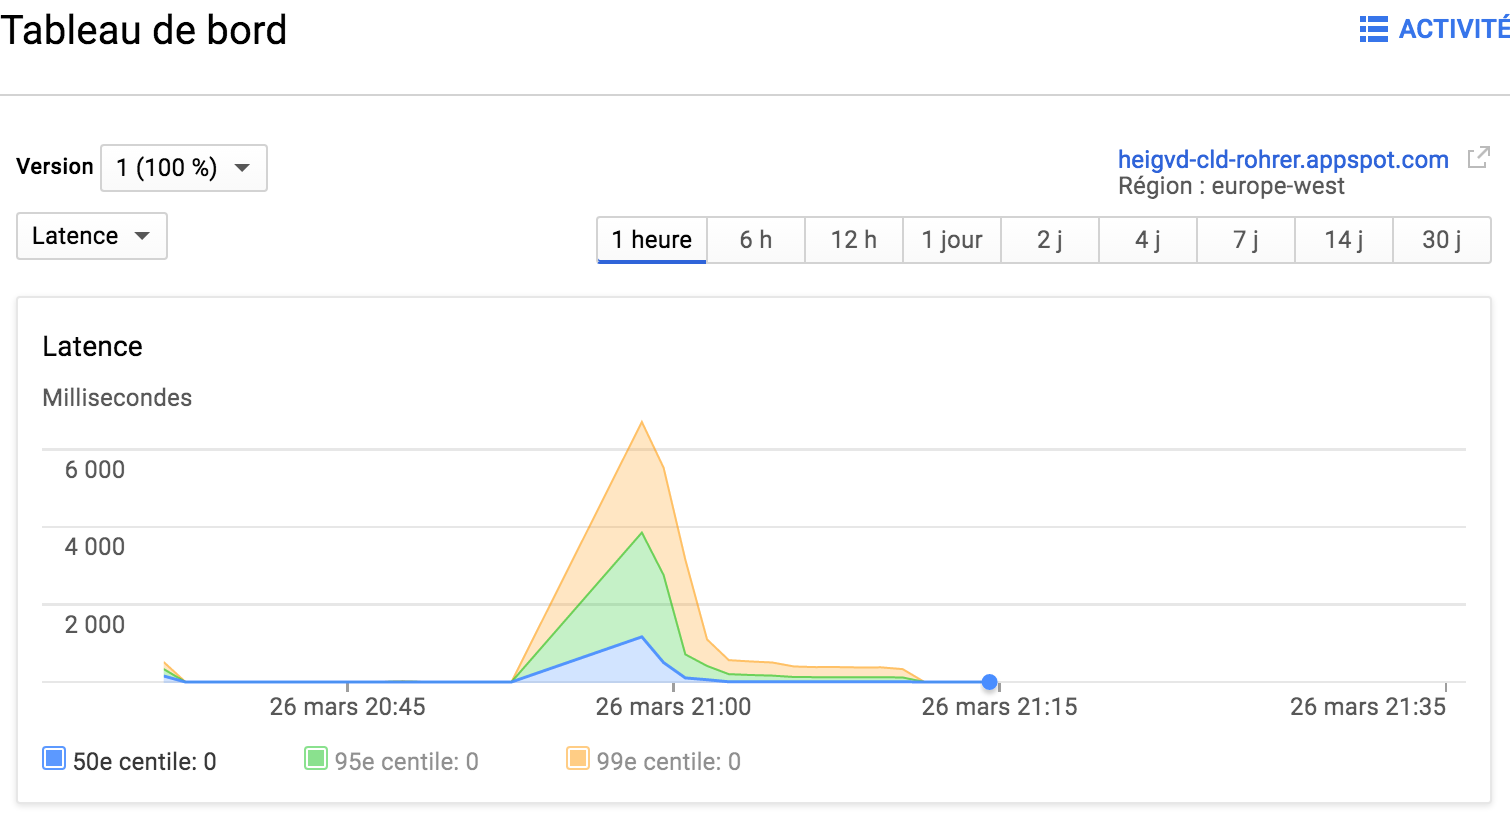
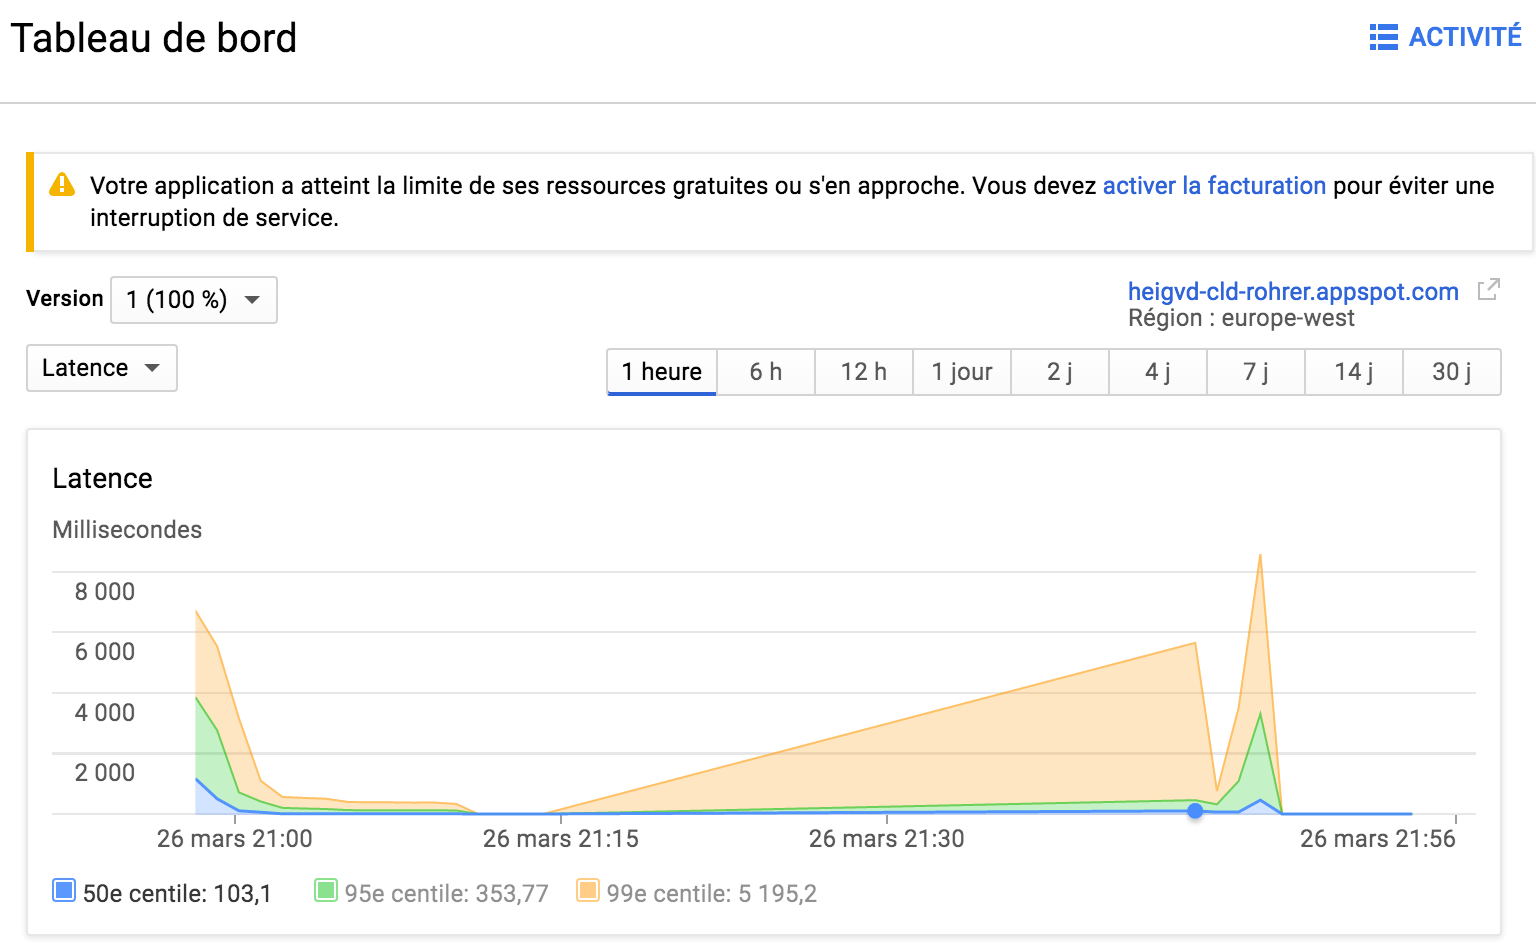
Latency Graph
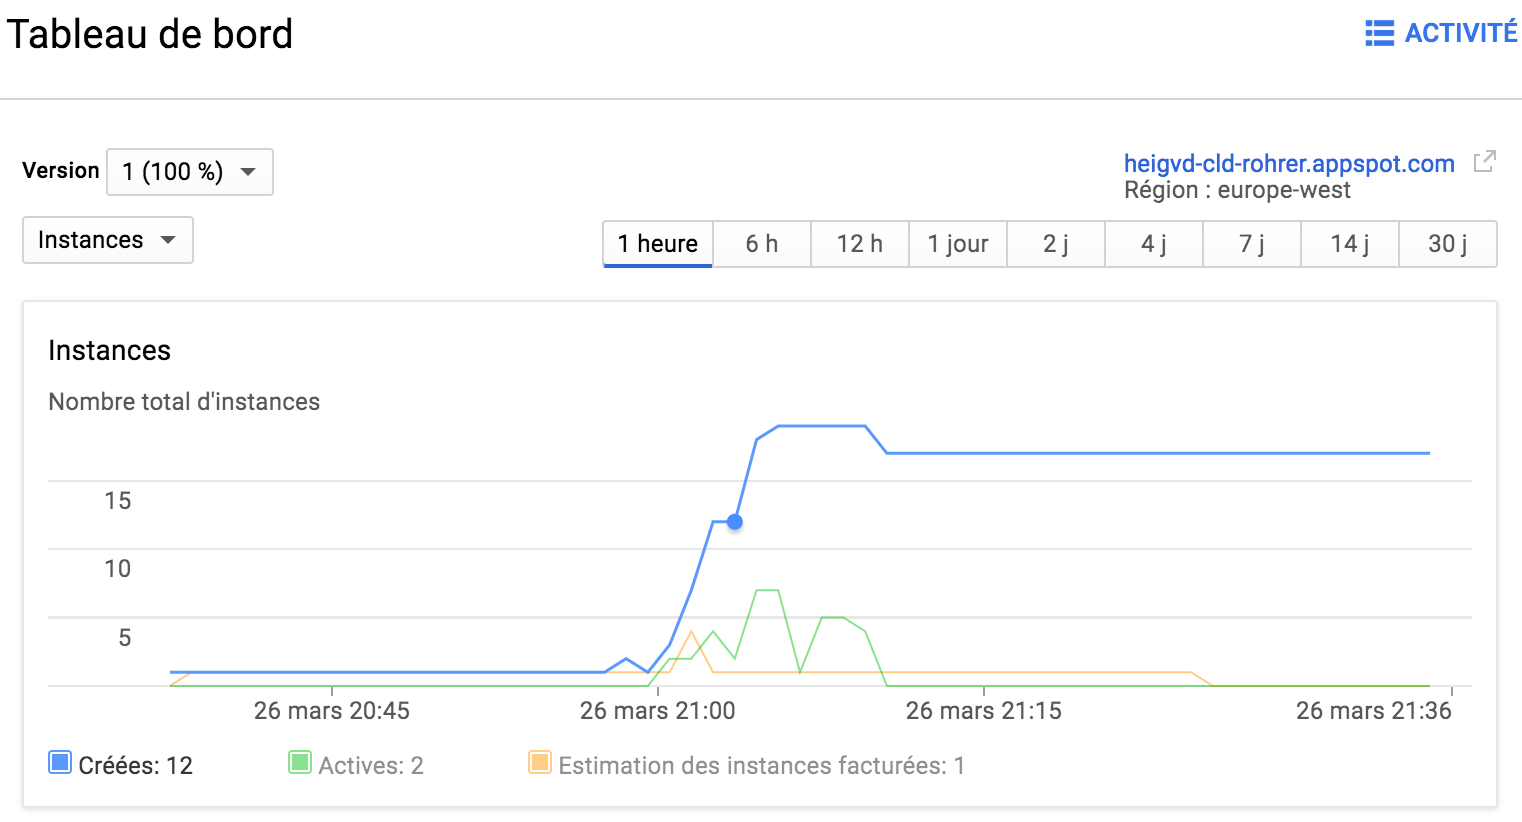
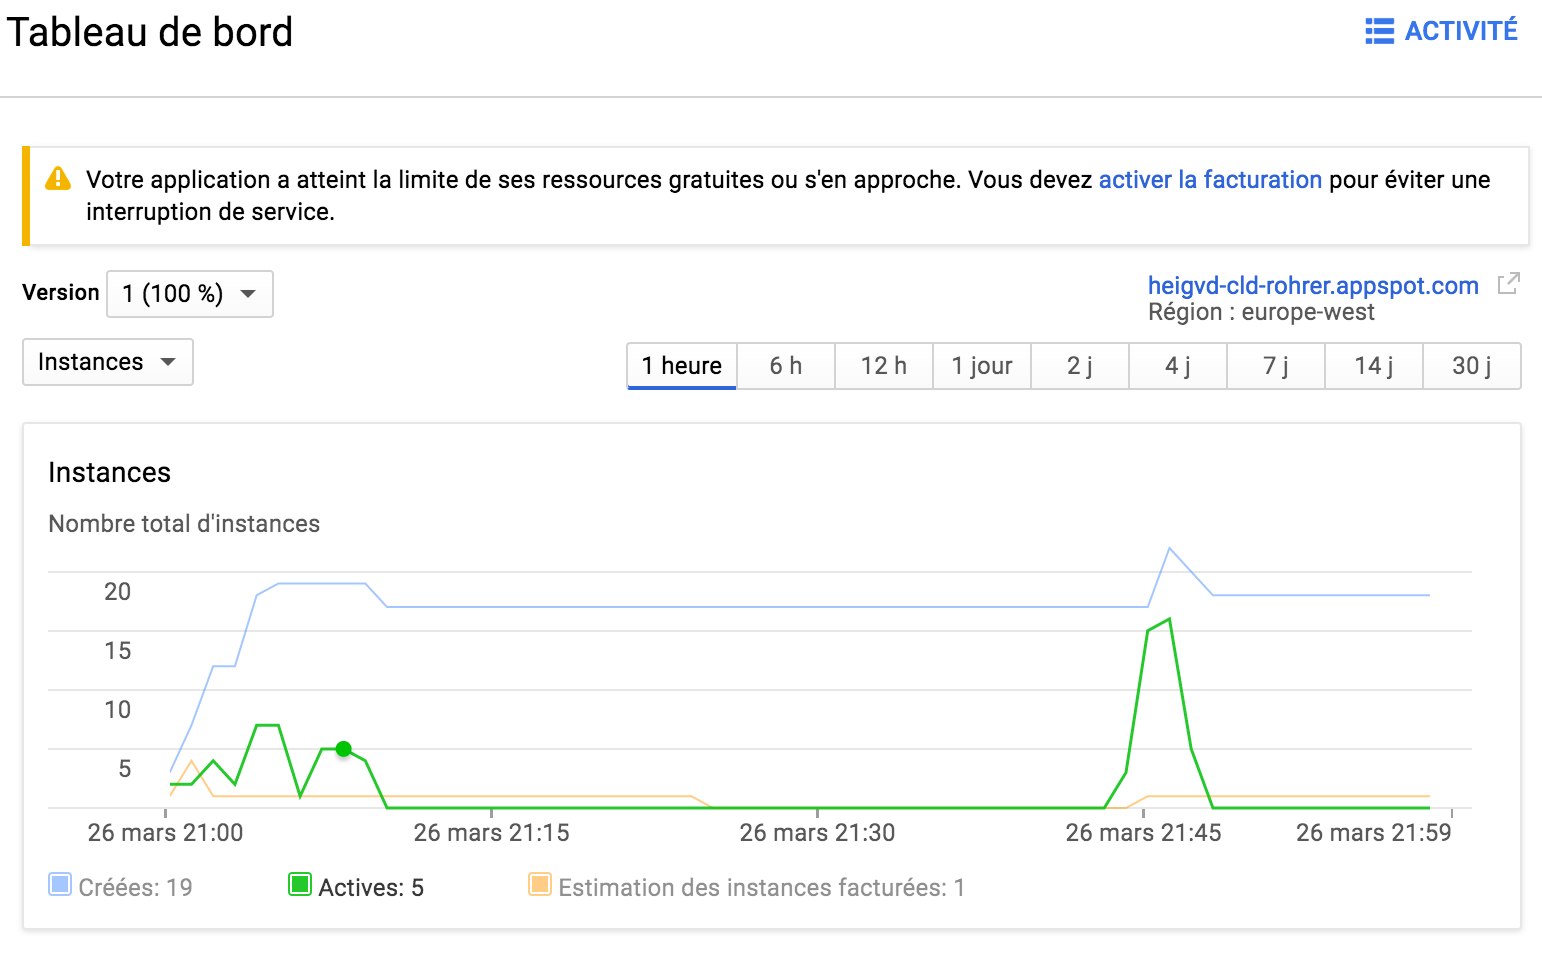
Instance Graph
Stress test without storage
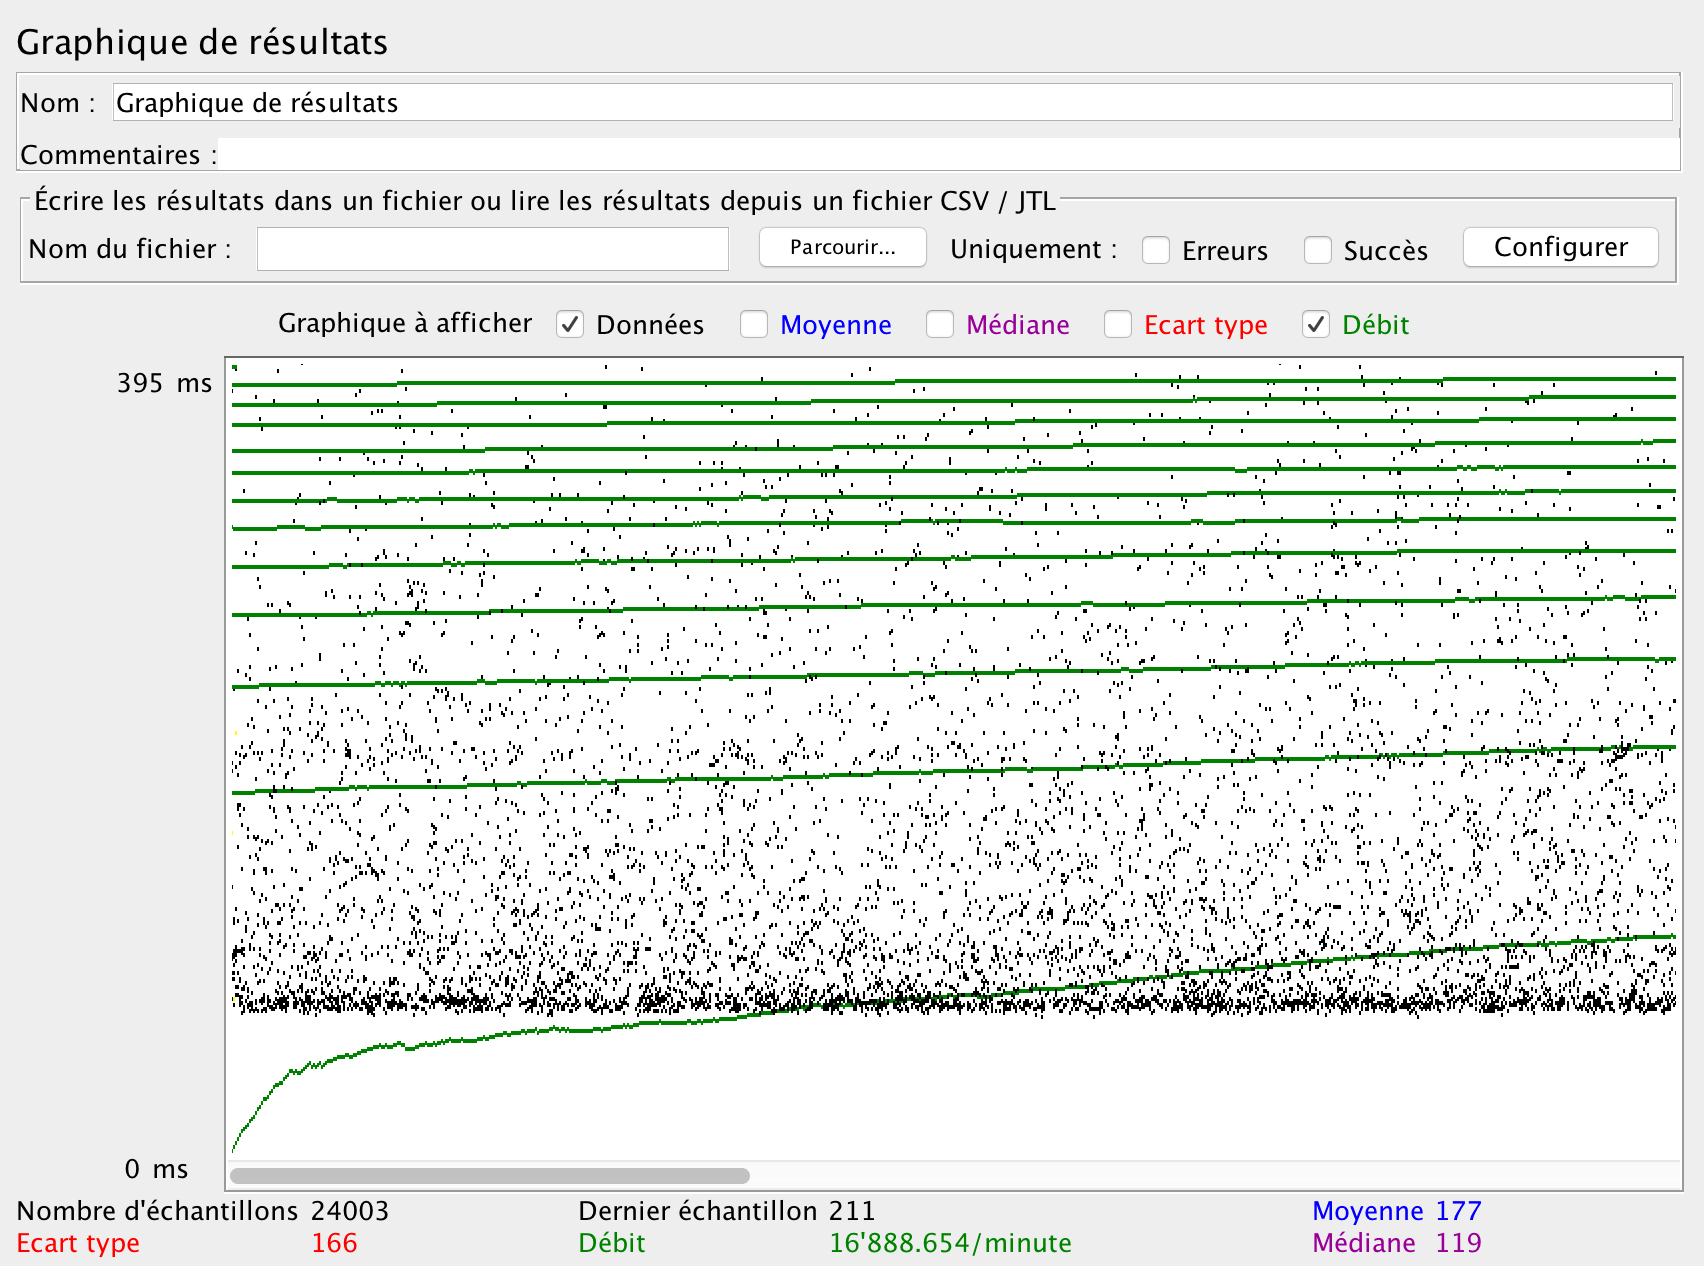
JMeter Graph Results
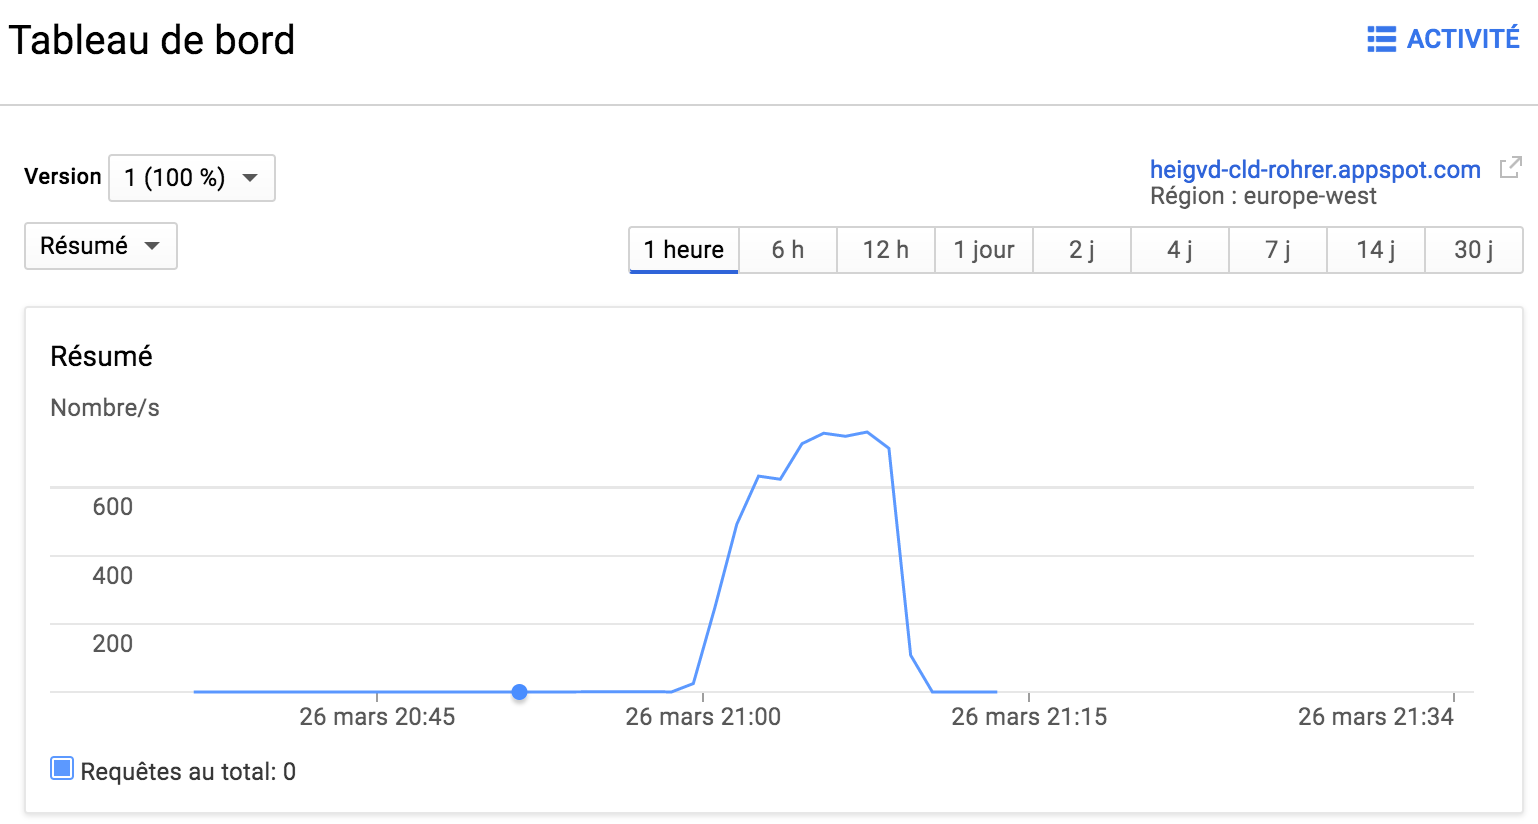
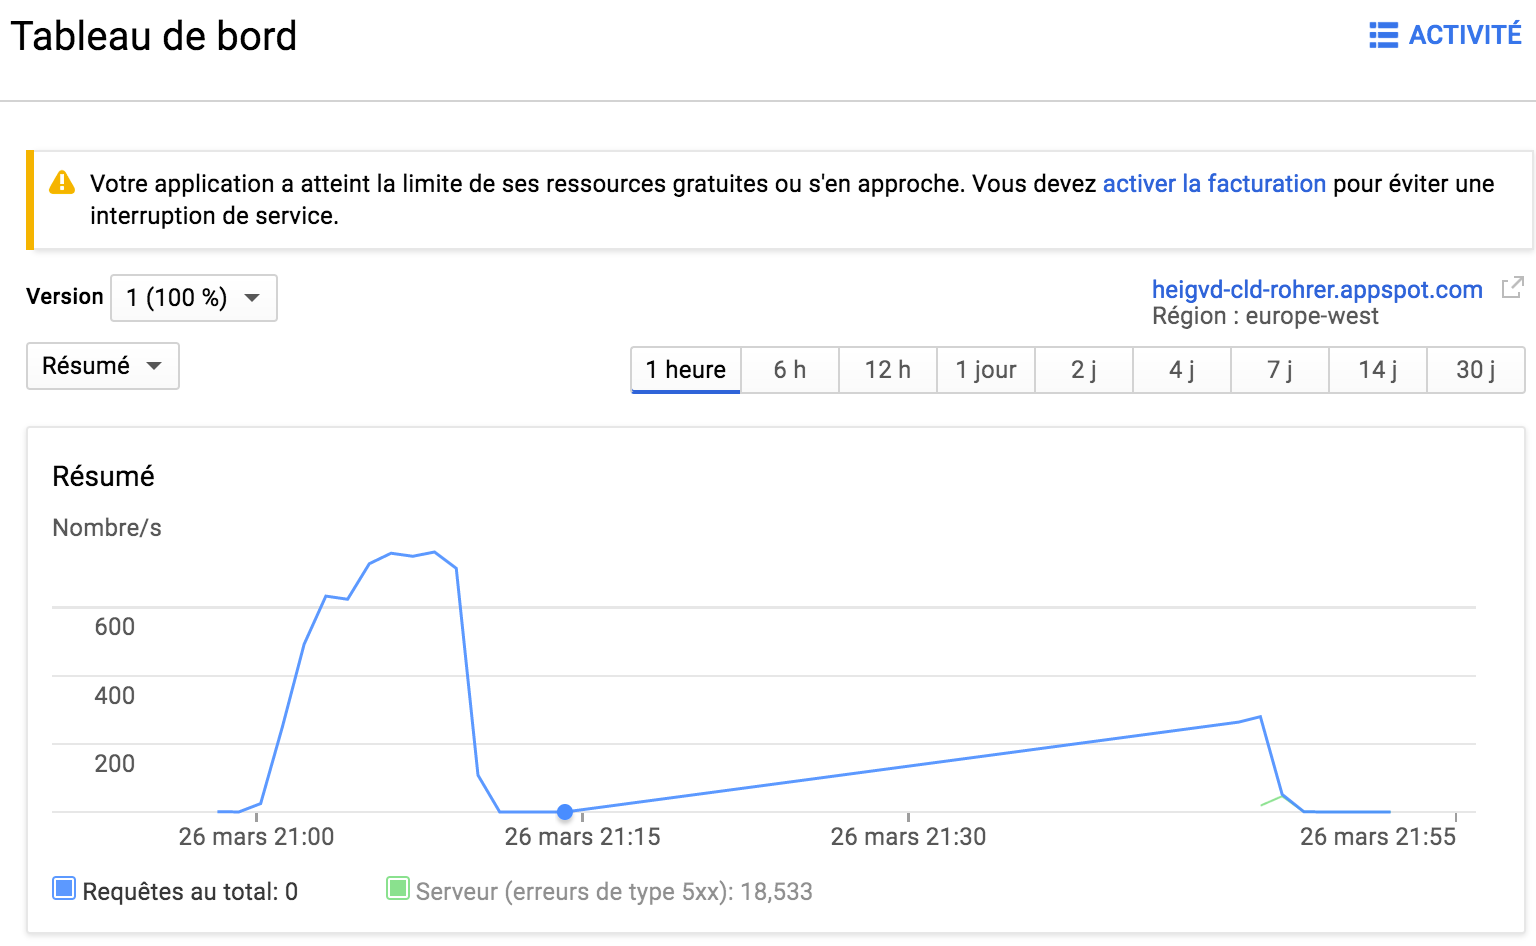
Request Graph
Latency Graph
Instance Graph
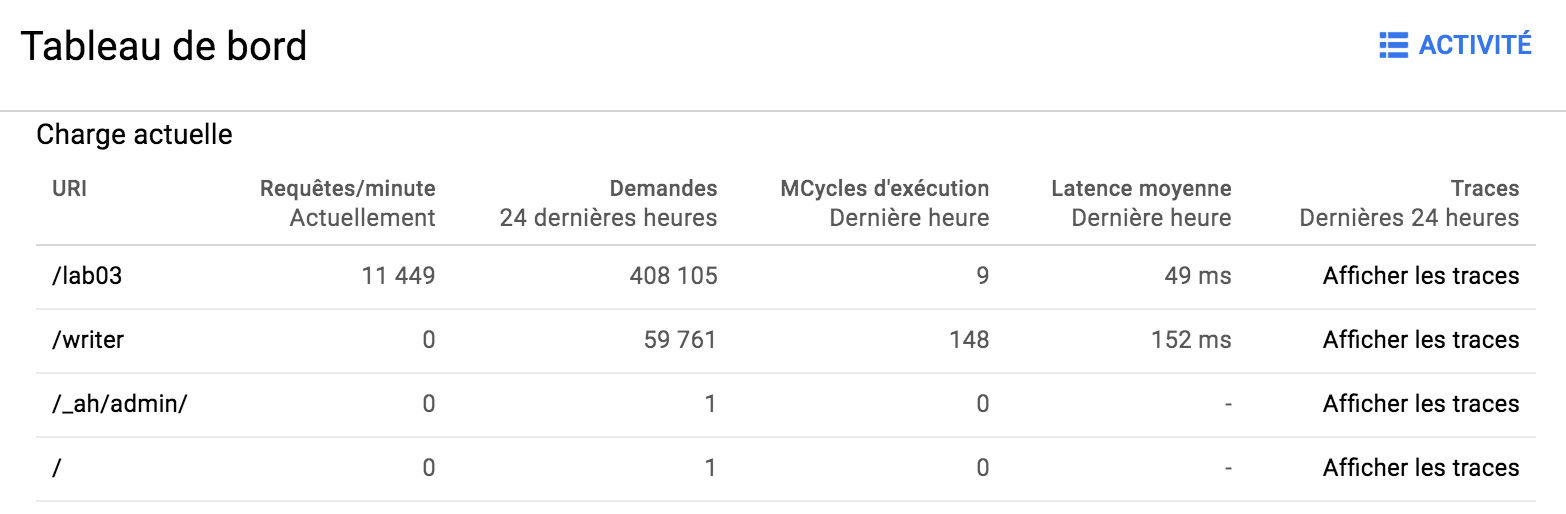
What response times do you observe in the test tool for each Servlet?
For the stress test without storage, we can see that the average latancy is about 74 ms. For the stress test with storage, we can see that the average latancy is about 177 ms. It is slower because it takes much time to write data into the datastore.
Compare the response times shown by the test tool and the App Engine console.
We can see that there is a différence between the responce time shown by the test tool and the App Engine. It comme from the way the App Engine computes the response time. It uses the average latency over one hour while the test tool use the average latency saw during the time of the stress test.
How much resources have you used running these tests?
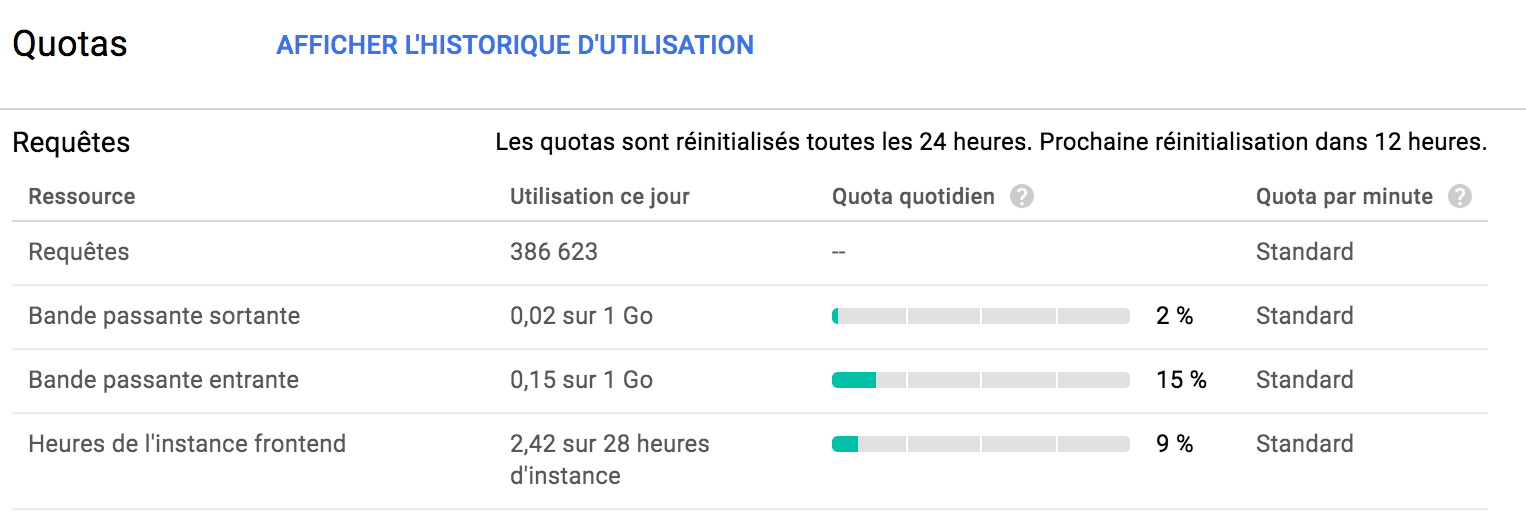
For the request quotas, we can see that 386'623 requests has been sent to the server. Only 2% and 15% of the daily outgoing and incomming bandwidth has been used. Incomming requsts seem's to be bigger than the response they require. Finaly only 9% of the daily frontend instance were used by these tests.
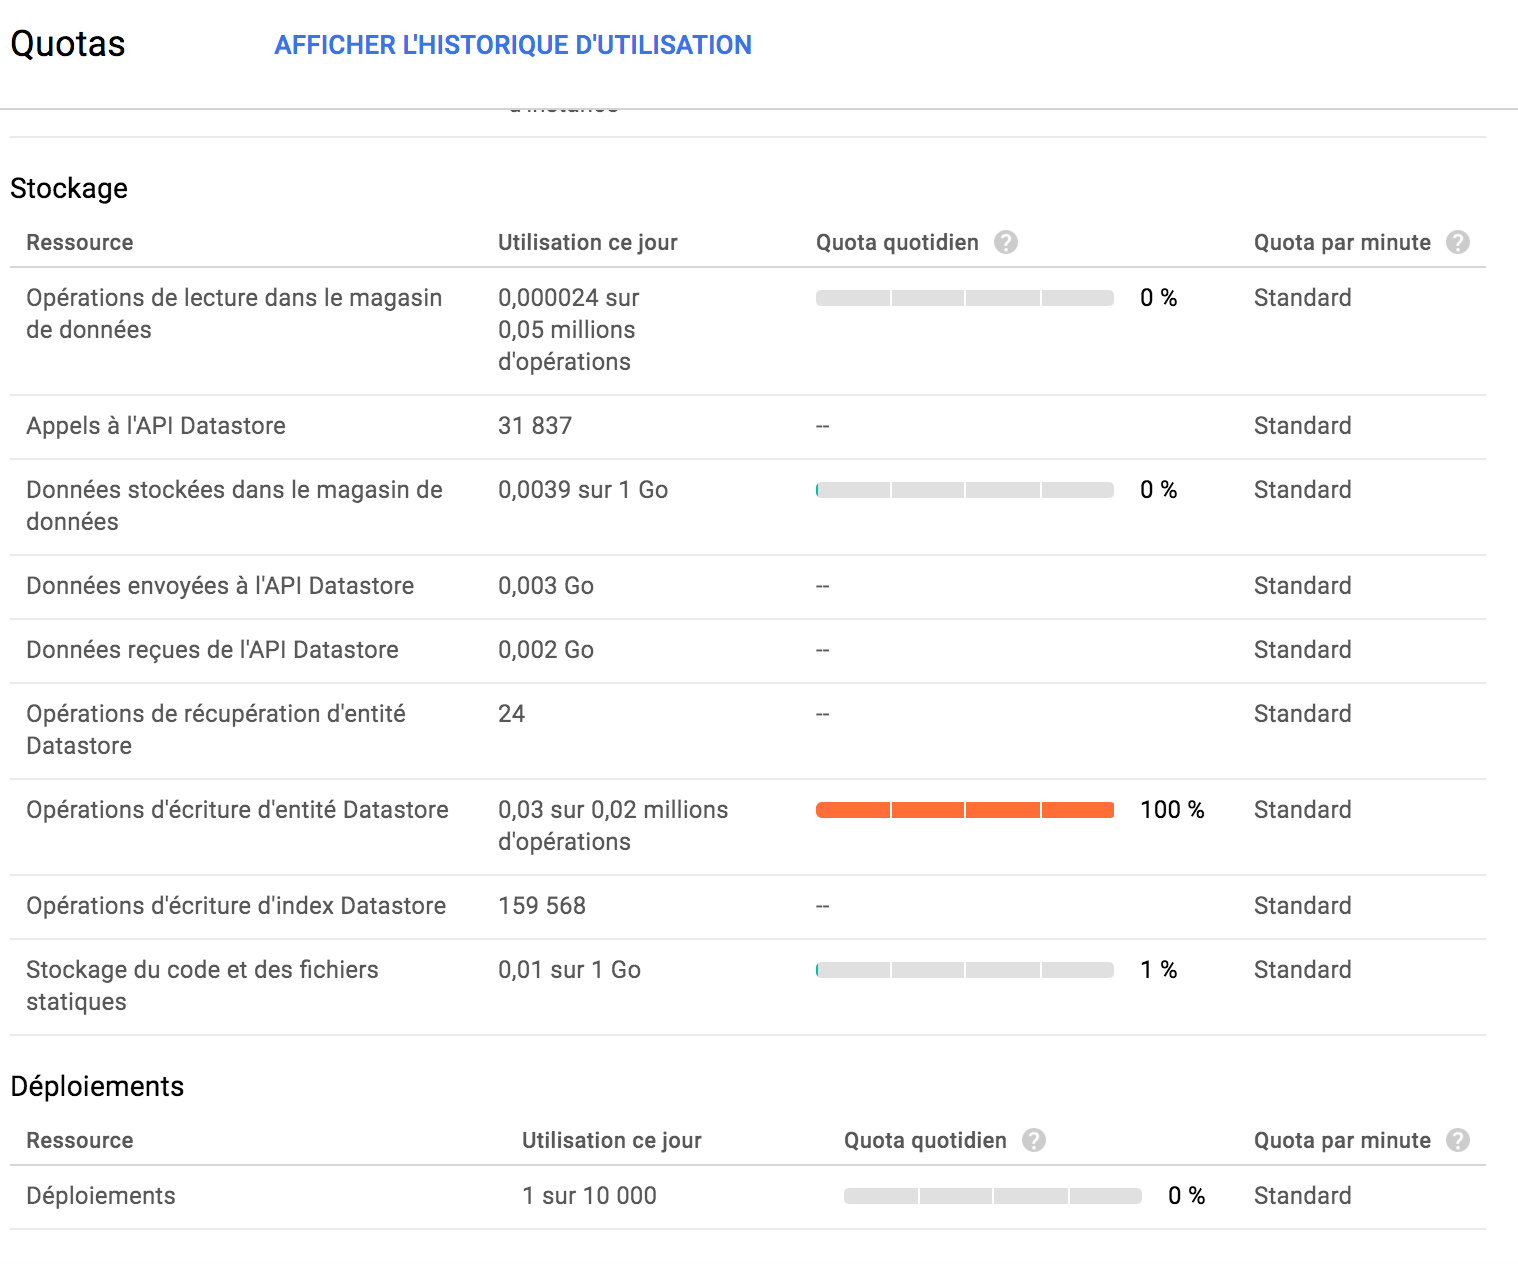
For the storage quotas, we can see that 100% of the datastore entity write operations has been consumed by the stress test with storage. Indeed, lot of writting requests has been sent to the server. Finally, only one percent of the storage allowed has been used for the storage of our code and our static files.
Let's suppose you become suspicious that the automatic scaling of instances is not working correctly. How would you use the App Engine console to verify?
I'll go to the dashboard and have a first look at the incomming requests graph and the latency graph to show if the response time seems to be suitable. If it's not the case, I will have a look at the instance graph to see wether new instances have been created according to the number of requests made to the server. If it is not the case, there is a problem.
Give an example of how the automatic scaling could fail. Which measures shown in the console would you use to detect this failure?
To detect this faillure, it is clearly the average response time that I will use. If it is too high, the application has probably some difficulty to handle the incomming traffic. This could comes from a malfunction of the automatic scaling process. The automatic scaling process could fail because we exceed the fixed daily limit of scaling instance which is fixed to 20 with a free app.